Multiple times a year, our statewide Wilder School Commonwealth Poll provides policymakers with an up-to-date snapshot of public opinion on current policy issues in the commonwealth. On this page you'll find information about recent poll highlights, as well as poll data organized by topic and by date.
Thursday, July 24, 2025
Virginians split on state direction
Poll Highlights
Our most recent poll was conducted from June 19 to July 3, 2025, with results released in July 2025. The poll asked Virginians for their perspectives on:
- The Virginia gubernatorial election
- Approval of Gov. Glenn Youngkin
- Approval of President Trump
- The economy and tariffs
- College affordability
- Medicaid cuts
- Federal workforce reduction efforts
- Federal DEI programs
- Immigration
Virginians share their perspectives on key issues
49%
plan to vote for Spanberger
37%
plan to vote for Earle-Sears
51%
oppose federal workforce reductions
67%
oppose proposed Medicaid cuts
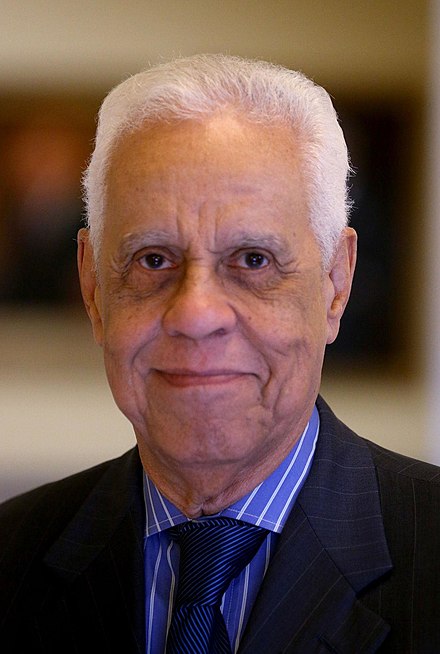
Virginia has always helped define the course of this nation, and now in 2025, we are facing a defining moment once again. This latest poll reveals that 67% of Virginians oppose Medicaid cuts, 63% reject Governor Youngkin’s vetoes on affordable housing, and a majority disapprove of efforts eliminating diversity, equity and inclusion programs. Leadership is not measured by how loudly one appeals to partisan politics but how one protects people’s dignity, freedom, health and future. The people of Virginia are watching, and as always, they are ready to hold their leaders accountable.”
Governor L. Douglas Wilder
66th Governor of Virginia

We are proud to have the Wilder School’s Commonwealth Poll selected as a Presidential Election Poll by CNN Politics for the first time in VCU’s history. Selection as a CNN-approved poll solidifies the Commonwealth Poll among the top polling operations in the nation while elevating the voice of Virginians.
Methodology
Our most recent poll was conducted from June 19 to July 3, 2025, with results released in January 2025. The methodology is as follows:
- 809 adult Virginians surveyed
- Phone survey (Landlines/Cell) – dual sample design on listed landline numbers and random digit dialed (RDD) cell phone numbers
- Sample weighted by demographics: gender, age, education, race, Hispanic origin, and region
- Overall margin of error: +/- 4.16 percentage points
References
For more information about the results, questions, and data, visit the links below:
For a comprehensive list of past poll questions, visit our Poll Guidebook.